Track questions through time
Table of contents
You can track the question through time, which is particularly relevant for long lasting or ongoing surveys. Timeline can be added for all question types except matrixes and textbox (word cloud).
All added timelines have time period on the X-axis.
NPS questions have Score (-100 through 100) on the Y-axis, while other question types show number of answers on the Y-axis.
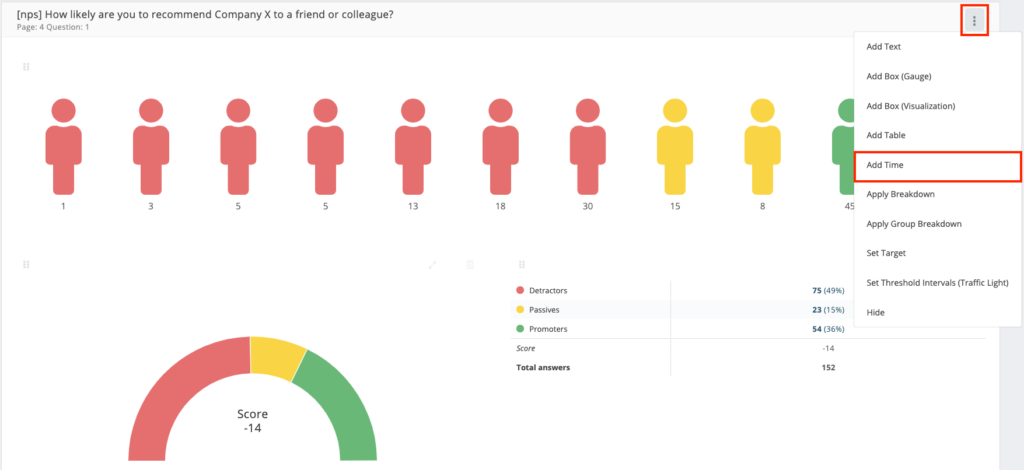
Adding question timeline
- Click on ⋮ in the upper right corner of the question dash
- Select Add time
- Question timeline box will be added to the question dash

Edit question timeline
When adding a timeline you can set a time frame, set a step in X-axis, change graph type, and move, resize and delete timeline.
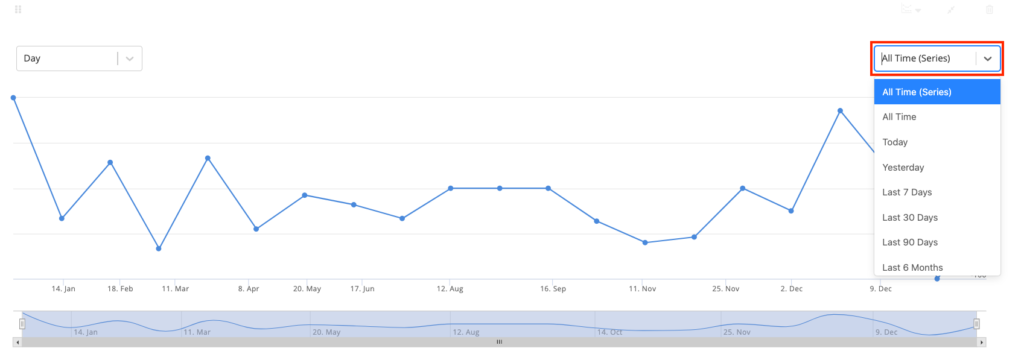
Setting the time frame
The added timeline always inherits the time-filter selected for the whole report. If no timefilter selected “Al time” is a default option. You can choose a different timeframe for the selected question and it will override the default setting.

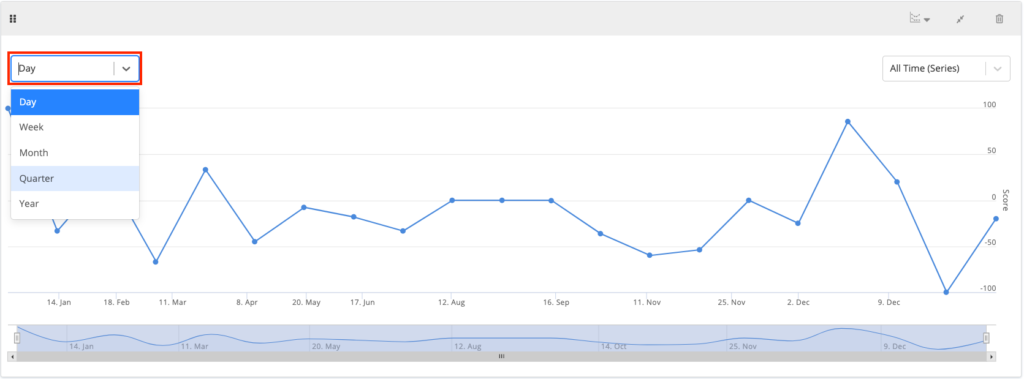
Setting the step in X-axis
The step in the x-axis is set automatically depending on the time-frame you select for the graph. But it can be changed in the dropdown in the upper left corner of the timeline box.

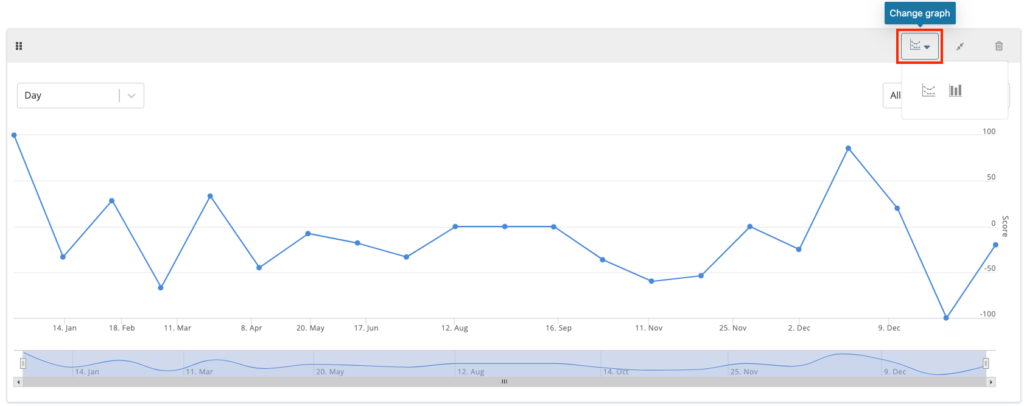
Changing graph type
you can choose to present the time graph as a line- or as a bar chart. Click on the chart symbol in the upper right corner of the graph.

Move, resize or delete timeline
You can minimize the timeline box by clicking on the arrows in the upper right corner. Delete the box by clicking on the trash bin symbol or move it around by dragging and dropping it where you see fit.
Don’t want to read? Watch tutorial:
Can you please provide more feedback so we can make this article better?