
Product News 03-2025
Netigate Product News for March 2025
Welcome to the ”first” ever Product News for Netigate! This is where you can learn about the ongoing features and updates that we are releasing for the platform. We expect to do these around the first Monday of every month moving forward. You can also read this news on our website. With that, lets get into some exciting new features!
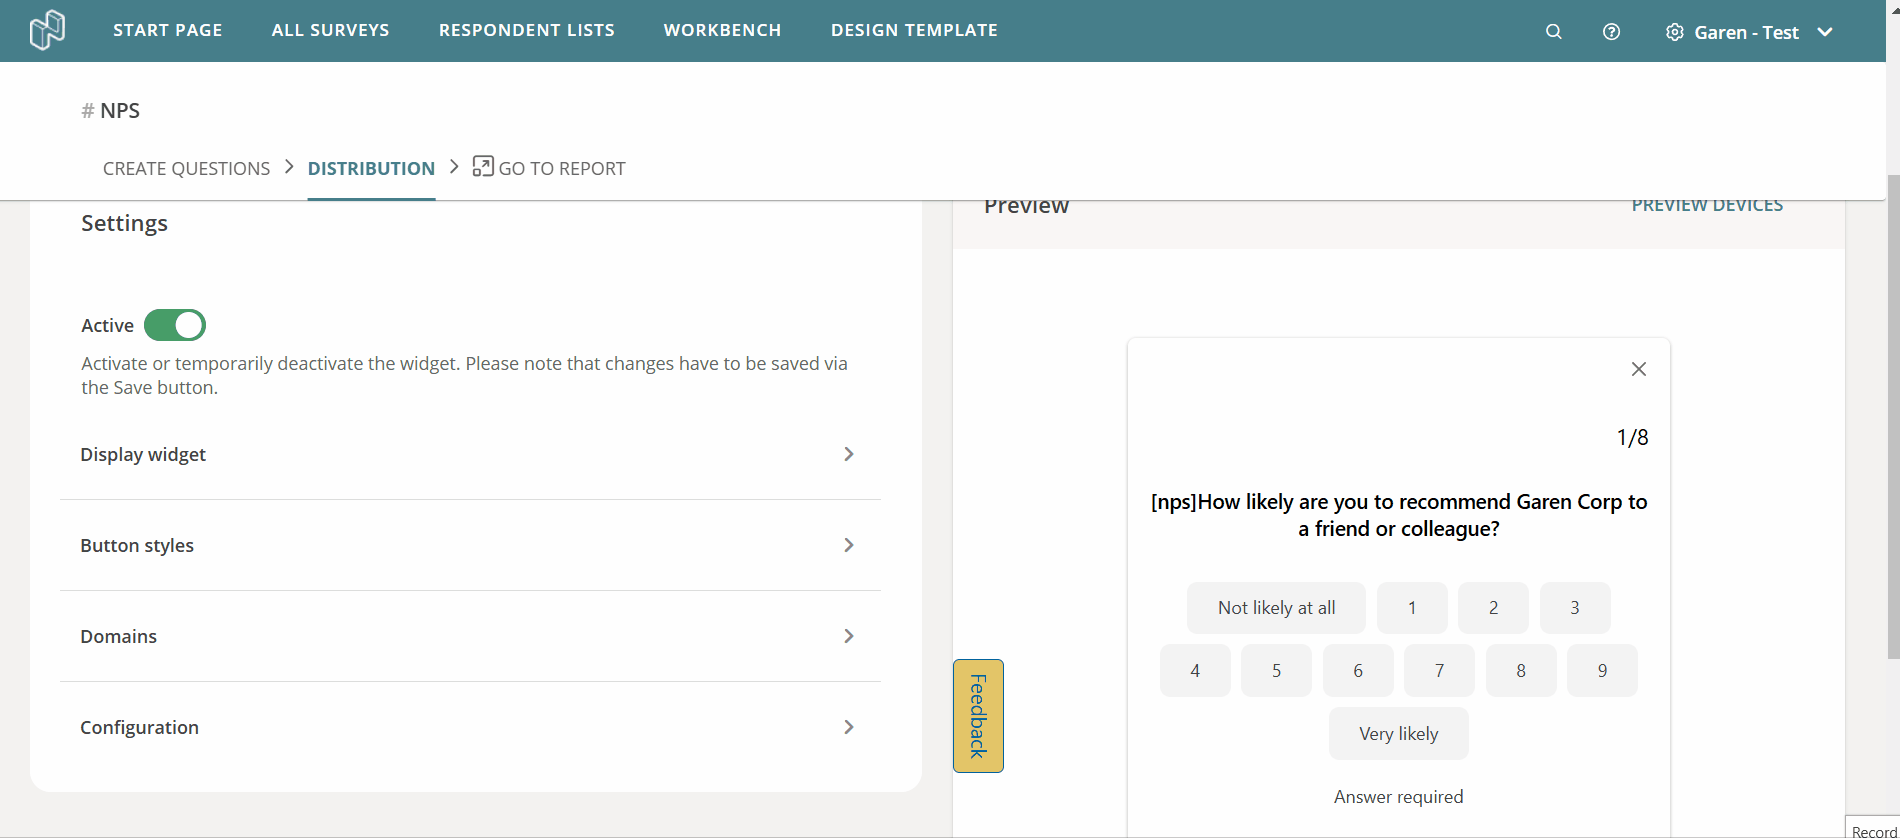
New survey Widget now previews in real time
The Widget is a type of survey distribution method that allows you to install your Neitgate survey into an external website or app. After, the survey will appear as visitors land on the page, take certain actions, fill out certain fields, or just click the button marked ”feedback”!
While the widget itself has existed for a while, we changed how the widget gets created within Netigate to make it easier to use. This includes a real time preview of the widget, as you make changes! Check it out in the GIF below:
Import Translations for your surveys
We’ve been getting feedback from customers that, while editing translations from the UI works for smaller changes, if you need to make dozens of changes, it can be a bit cumbersome.
Thats why we developed a way for you to Export and then Import translations:
- View a sorted list of all translatable text in your survey
- Make changes easily and at scale
- Copy and paste translations from other services directly to your Excel
- Import your changes to have them live in your survey!
We hope you enjoy using the new Import Translations feature. You can read more about how it works and how you can get started using it from the article in our knowledge base.
Automatic Data removal through API
We have created some new endpoints in the API that allow you to automatically remove data after certain criteria has been met, such as:
- Automatically removing data after X amount of days have passed
- Automatically removing data on a set date in the future
- Deleting specific responses from a survey, based on ID
- Partially removing data
You can read more about these changes, as well as example payloads, through our API documentation.
NPS Benchmarks have been updated!
If you are using NPS in your survey, we offer the ability to view Benchmarks for NPS scores. These benchmarks are pulled from Netigate, based on our customer base, consultant experience, and industry practices.
Now, the NPS benchmarks have been updated with the current 2025 business landscape. If you use NPS, we highly recommend you check them out! You can learn more about NPS benchmarks in our article on the topic.
Upcoming webinars
- FRÅN DATA TILL HANDLING: BYGG EN CX-STRATEGI SOM GER VERKLIGA RESULTAT – We have an upcoming webinar series in Swedish that covers exciting new ways to analyze surveys responses!
Recent Knowledge base updates
- New Widget – Added section about Google Tag Manager
- Create a Powerpoint Template – Added section on how to make the Powerpoint smaller so that it conforms with our file size upload requirements
That’s all folks! Thanks for reading!
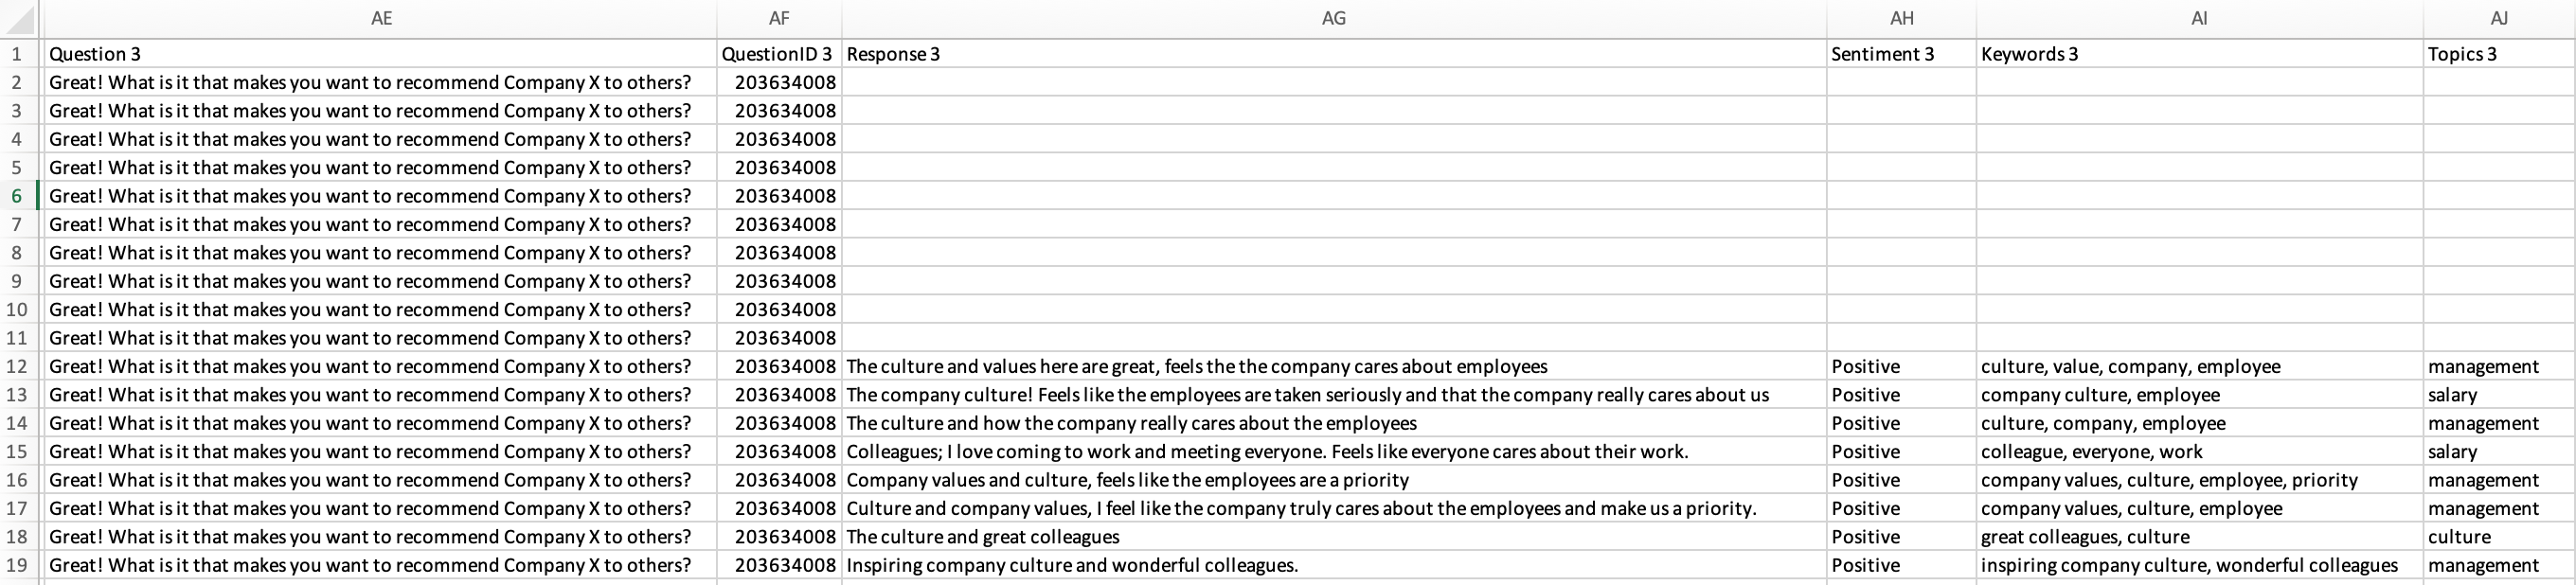
Now available: Excel and RAW export for Text Analysis answers
Excel exports now include Text Analysis answers in Text Analysis-enabled surveys. A separate tab in the Excel export will be populated, showing sentiment, keywords, and topics.
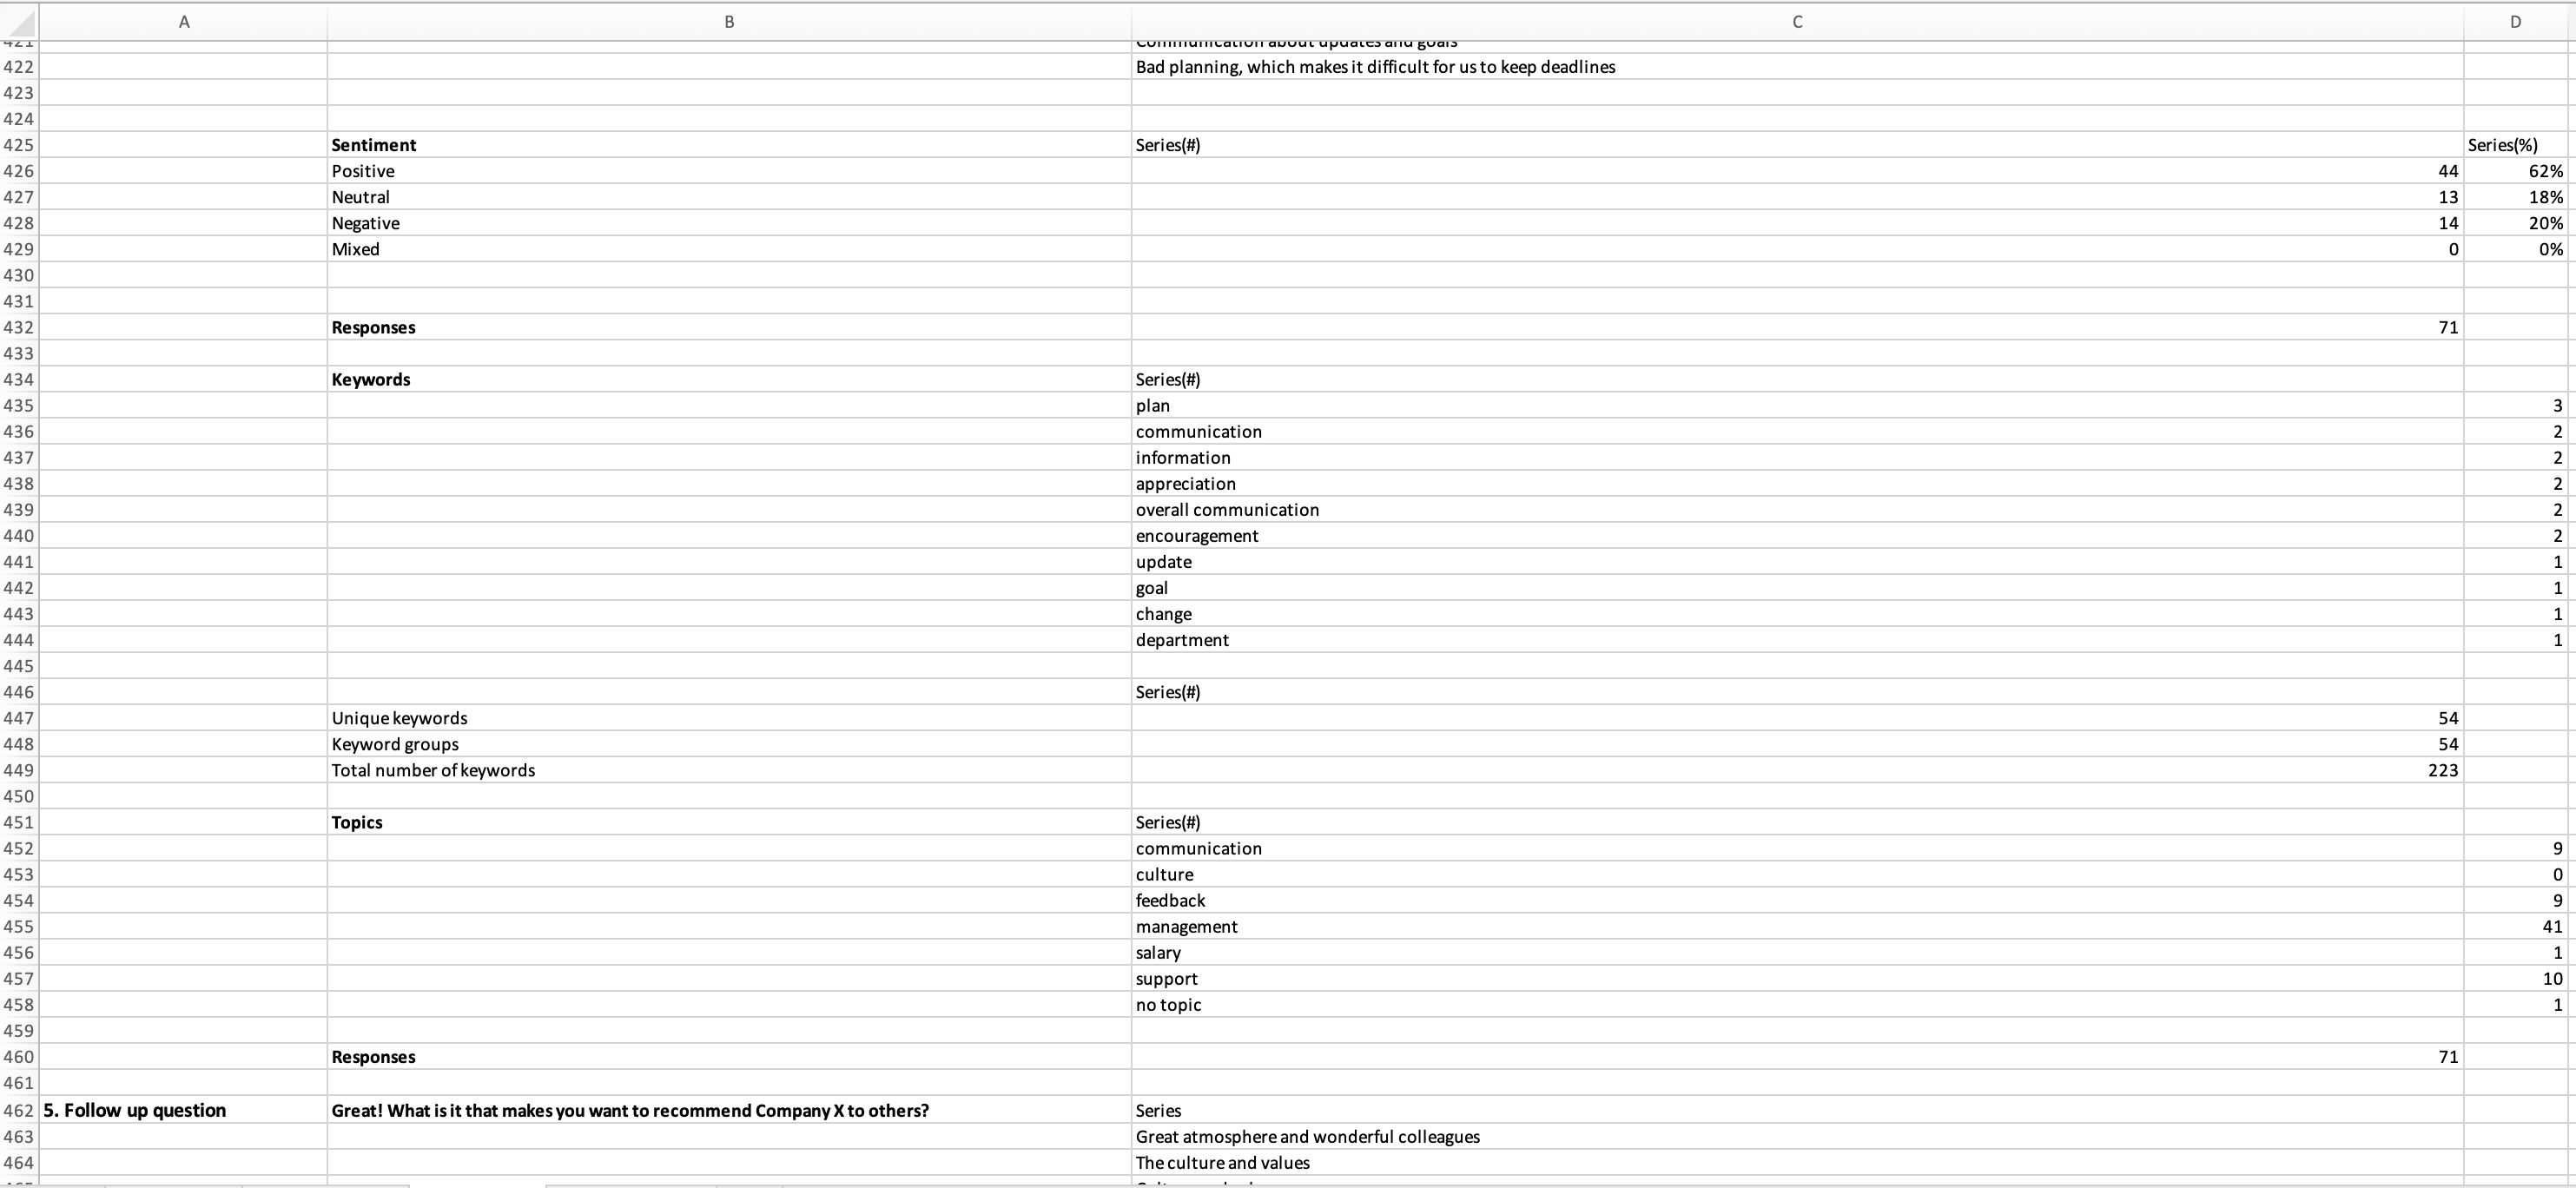
RAW exports now include Text Analysis answers in Text Analysis enabled surveys. A separate tab in the RAW export will be populated, which includes all background information from the values page, and shows all Text Analysis answers with sentiment, keywords and topics for each open text response. Responses will display each individual respondent per row.
New to Text Analysis? Download our Quick Start guide here.
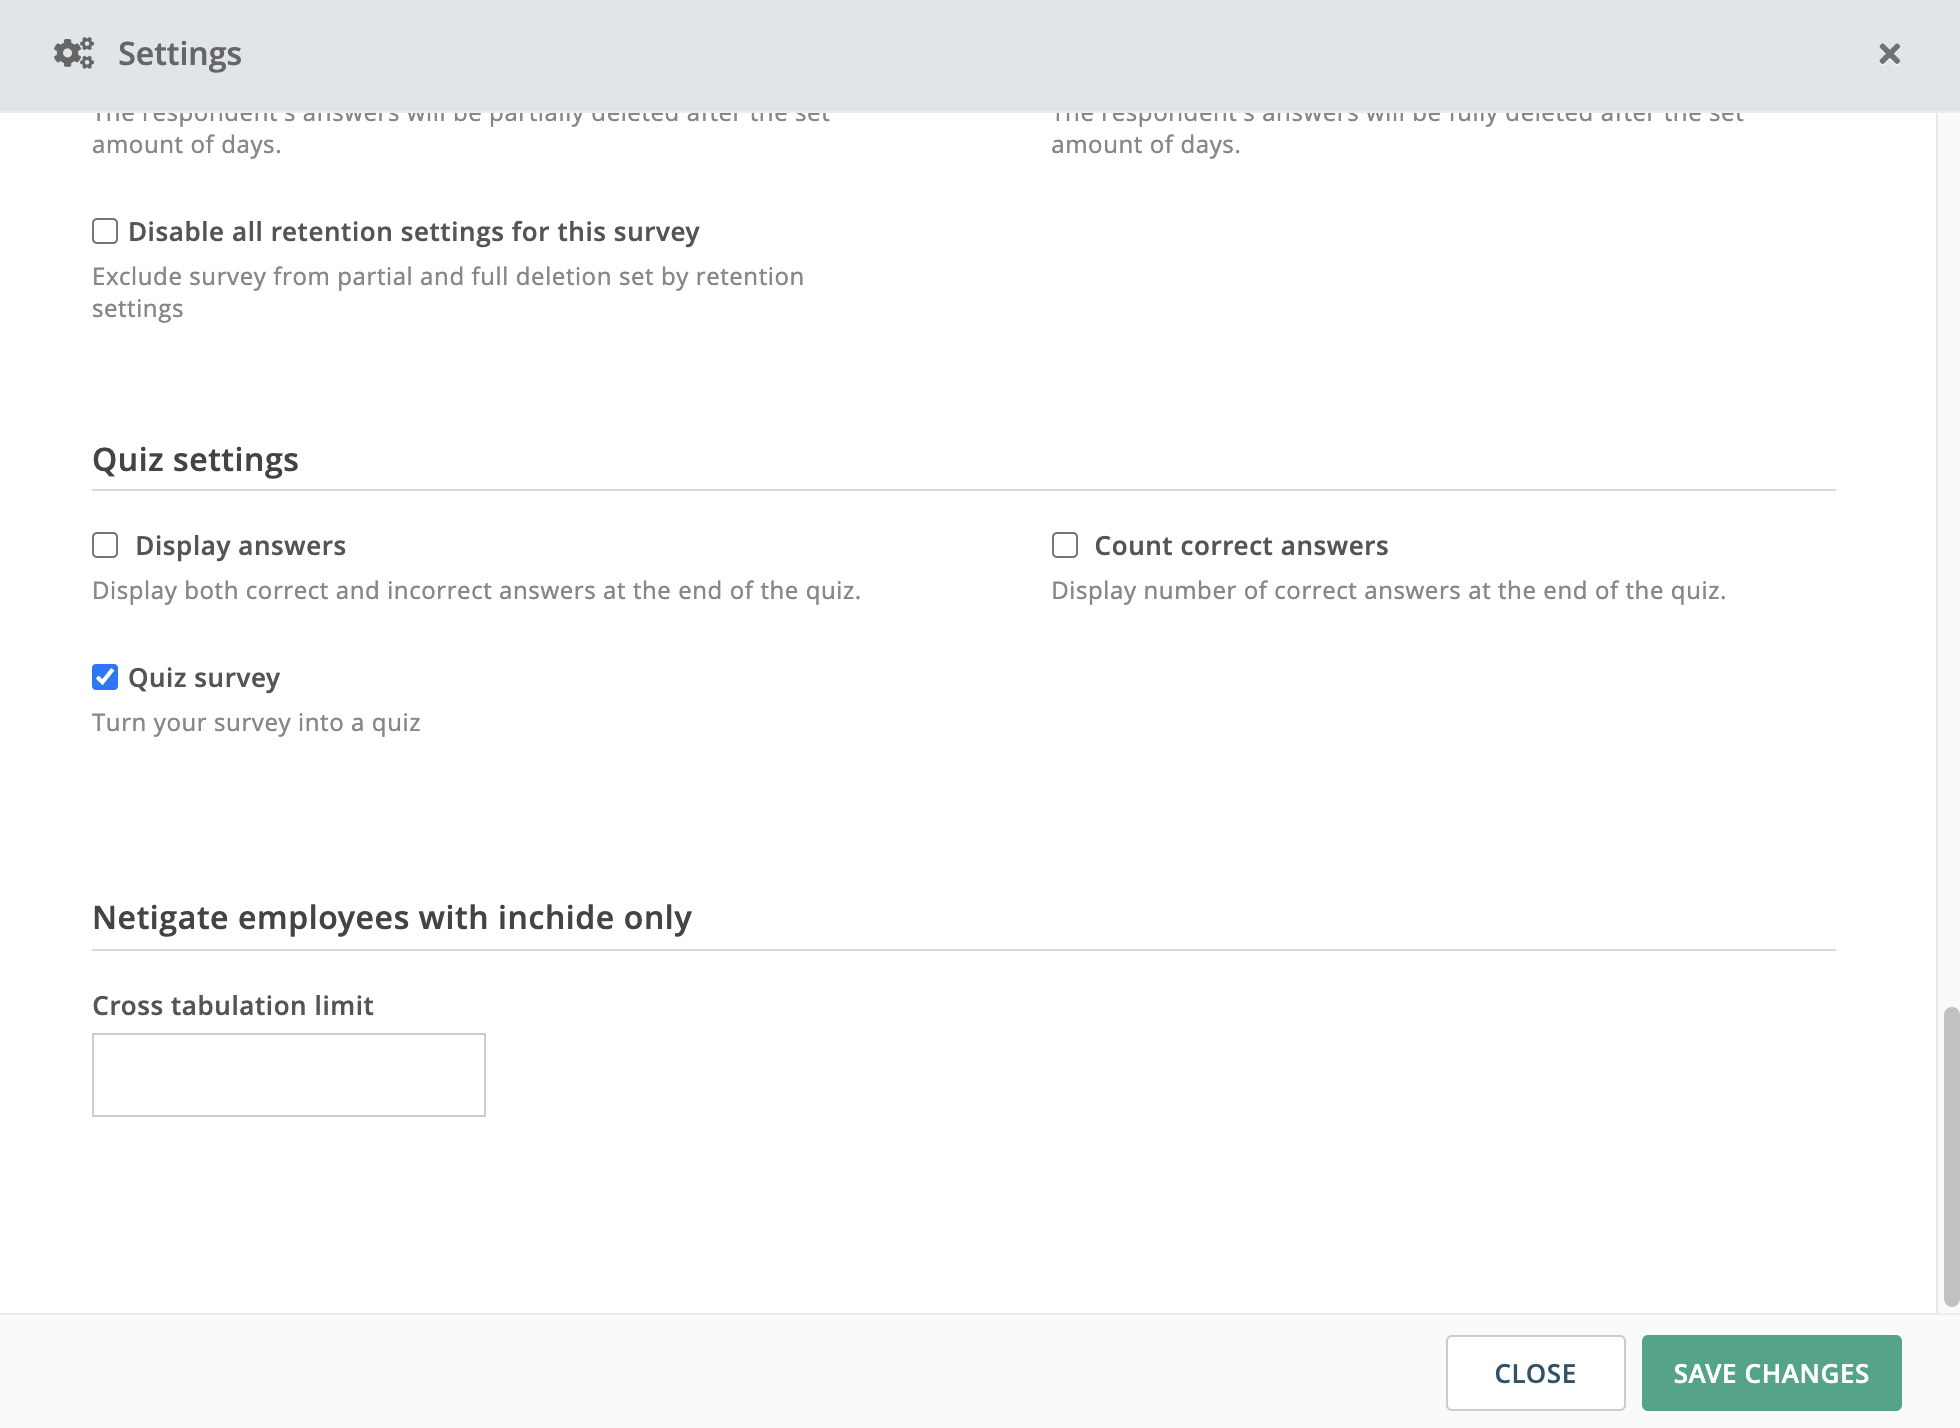
Quiz settings
A Quiz survey option has been added to the Survey settings menu, which will turn your survey into a quiz. By turning this setting on, only question types and options that are compatible with a quiz survey will be active. All questions types except radio buttons, info text, media and background data will be disabled.
Related: Quiz inställningar
Exportera visningsstatistik och inställningar för delade länkar till Excel
Du kan nu exportera visningsstatistik och inställningar för delade länkar till Excel. Välj vilka rapport du vill titta på och ladda ned filen på ett klick.
Den här funktionen förenklar felsökning när du delar flera rapporter med olika inställningar. Dessutom så får du med information om rapportens visningar. Du kan se vem som har tittat på den delade rapporten och hur många gånger den har visats.
Se vilka mottagare som har tittat på din delade rapport, och vilka som inte gjort det!
Se vilka mottagare som har tittat på din delade rapport, och vilka som inte gjort det! Vi har lagt till en kort översikt av statistik för delning- och visningar under Sparade rapporter.
Delade rapporter kan nu exporteras till din PowerPoint- mall
Delade rapporter kan nu exporteras till anpassad PowePoint-mall. Välj mallen under DELA> Inställningar > Tillåt exportering.
Netigates standardmall är markerad som standard men kan ändras till anpassad mall om du har laddat upp en eller fler PPT-mallar i ditt konto.
Rapporter som delas via e-post är nu markerade med en ikon och samlas under sparade rapporter
Rapporter som delas via e-post markeras nu med en kuvertikon och samlas under sparade rapporter >Delad. Autospar inställning är inaktiverad för alla delade rapporter för att förhindra oavsiktlig ändring.

Visualisera mål och framsteg i dina Netigate rapporter med målvärden och tröskelvärden
För dig som har Professional – eller Enterpriselicens har vi nu aktiverat målvärden och tröskelvärden. Genom att ställa in målvärden kan du infoga visuella markörer för dina mål i din rapport i Netigate. Tröskelvärdet ger dig sedan ett trafikljussystem som hjälper dig att tydligt följa upp statusen på dina mål.
Se videon nedan för att lära dig hur du använder funktionerna på mindre än två minuter.
Visa lista av dolda ord
I den nya rapporten kan du nu inspektera och ändra listan över alla ord som du manuellt valt att dölja i dina ordmoln. Du kan också ta reda på om någon av dina svartlistor är aktiverade i ditt konto vilket förhindrar vissa ord från att visa i dina ordmoln (admininställningar)
Gå till Inställningar i ditt ordmoln och klicka på dolda ord i det högra hörnet. Då kommer då se alla dolda ord i en dropdown – meny. Om du ångrar dig och vill inkludera ett eller flera ord igen i ditt ordmoln väljer då enkelt den individuella kryssrutan eller Välj alla och klicka på Restore Words.
Om du delar en rapport som innehåller ordmoln med dolda ord, kommer dessa ord inte att synas för mottagarna.
Denna funktioner låter dig enkelt och effektivt jobba med ordmoln och inkludera och exkludera vissa ord från respondenterna.

Skicka e-post på nytt till enskilda/fler respondenter
I nya Netigate kan du nu enkelt skicka e-post på nytt till enskilda respondenter.
Gå till distributionsöversikt, klicka på antalet respondenter för respektive utskick. Ett nytt popupfönster kommer då att öppnas med respondentlistan. Välj respondenterna som du vill skicka e-post till på nytt genom att markera respektive checkbox och klicka på knappen skicka e-post på nytt i botten av popupfönstret. Du måste sedan bekräfta ditt val.

Flytta undersökningar till mappar
I nya Netigate kan du nu enkelt flytta dina undersökningar till olika mappar direkt från listan av dina undersökningar. Markera bara checkboxen till vänster för respektive undersökning som du vill flytta och klicka på knappen Flytta till mapp längst ner. Ett nytt popupfönster kommer då att öppnas. Därifrån kan du välja önskad mapp för undersökningen.

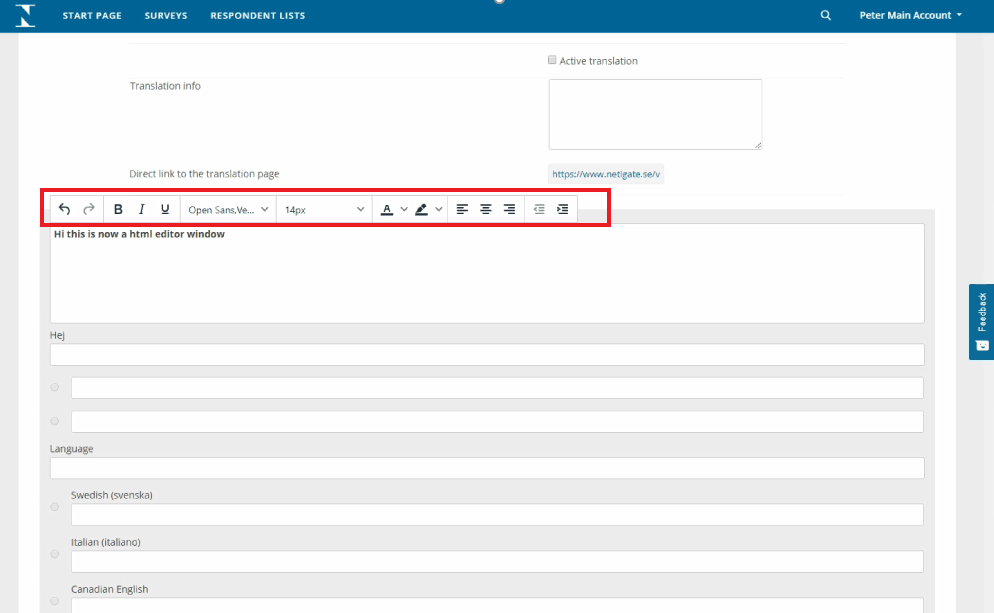
Textredigerare i flerspråkigt verktyg
En textredigerare har lagts till i varje fält i flerspråkiga verktyget i Nya Netigate. Detta låter dig formatera texten i dina översättningar snabbt och enkelt direkt från verktygsfältet, vilket gör det enkelt för dig att ha identisk formatering av din text på alla språk.
Respondentöversikt integrerad i menyn
Respondentöversikten finns du lätt tillgänglig i menyn till vänster i din rapport. Detta gör att du enkelt kan komma åt översikten av dina respondenter. Klicka på Respondenter i menyraden till vänster.
Vänstermenyn är också utformad för att tydlig skilja mellan tidigare sparade rapporter (Sparade rapporter>) från alternativen för att ändra den rapporten du arbete med (alternativet finns under Hantera rapporter).

Växla mellan rapporter och redigeringsläge
Om du vill växla mellan redigeringsläge och rapporten av din undersökning kan du göra det med ett klick. För att komma åt redigeringsläget klickar du bara på namnet på din undersökning. Du kommer då se en hyperlänk högst upp under din rapport.
Detta alternativ är särskilt användbart om du vill göra några ändringar i efterhand. Du kan till exempel snabbt göra en fråga till en viktad fråga och se resultatet i rapporten direkt. Vidare kan du snabbt se hur frågorna presenterats, layout, typen av frågor eller klicka på förhandsvisning för att se hur frågorna presenterades för respondenterna.
